How to Analyse Automotive Test Data
A Complete Guide for Vehicle Validation Engineers
How to analyse automotive test data. At Vehicle Testing Solutions (VTS), we help engineers turn complex logs and system behaviour into clear insight. This guide shows how to plan, review, and interpret test data so decisions come from evidence, not guesswork. It also highlights the functional and system factors that shape the results you see.
Step 1: Define Your Objective Before You Start Logging
Before recording a single signal, define what you’re trying to learn. More data doesn’t always mean better analysis — it often means more noise.
Ask:
• What system behaviour are we validating?
e.g. Battery performance during cold-start conditions.
• Which signals directly relate to this question?
Log only relevant CAN IDs, sensor channels, or fault codes.
• What decision will this data support?
e.g. Determine if voltage remains above 11.5V for 30 seconds at -20°C.
When defining objectives, explicitly state the system boundaries and dependencies:
• What other ECUs or subsystems interact with the one under test?
• Are we validating functional behaviour, network interaction, or fault tolerance?
• Do we expect communication from gateways or cross-domain signals (e.g., body ↔ powertrain)?
This ensures your data captures all contributing systems and interactions — not just the local ECU.
Step 2: Ensure Data Quality from the Start
High-quality analysis starts with high-quality data. Consistency, structure, and traceability prevent delays and wasted effort later.
Good Practice:
• Use clear file names (e.g. VehicleID_TestType_Date_Version.mf4).
• Synchronise timestamps across devices using GPS or NTP.
• Record ambient conditions and software versions.
• Version-control your logs and analysis files.
Additionally, capture the system configuration context:
• Software and calibration versions for every ECU.
• Vehicle operating mode (Ignition ON, Power Save, Run Cycle).
• Network topology — which ECUs were connected and which sub-nets active.
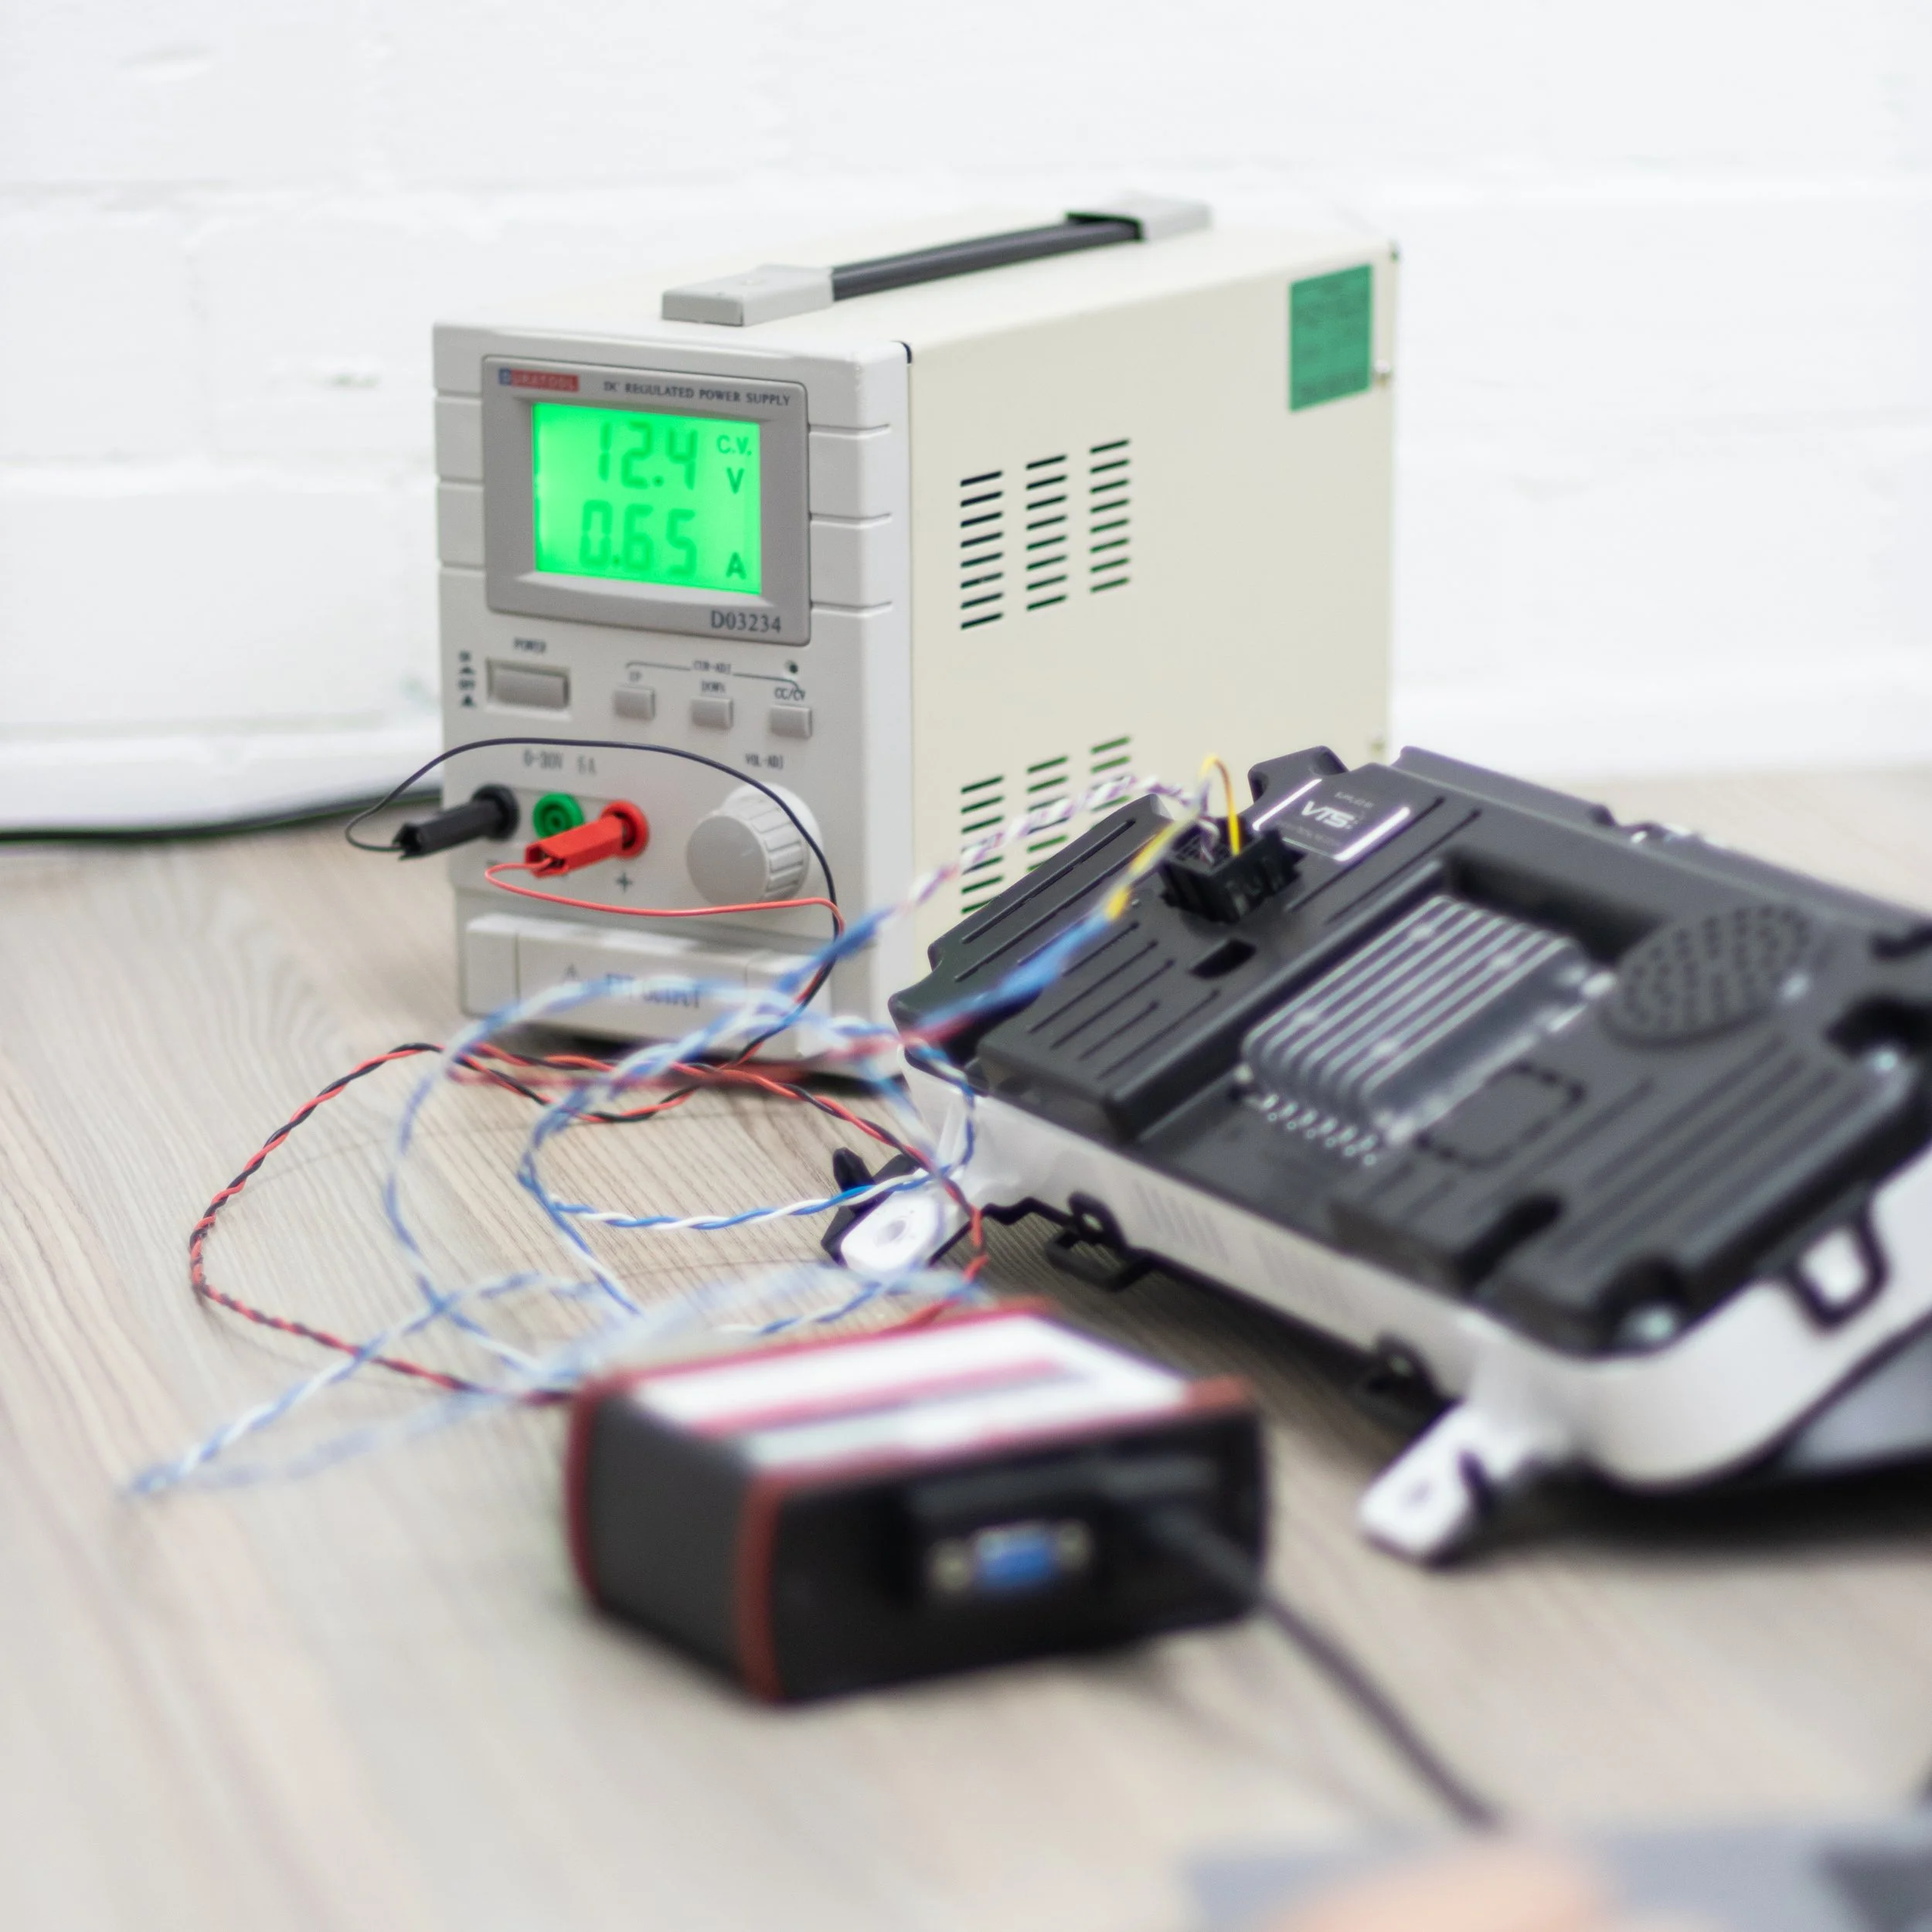
• Power supply source and any bench-rig simulators used.
Problem > Impact > Fix
Mismatched timestamps > Events can’t be correlated > Use GPS time sync
Inconsistent signal names > Time wasted matching data > Maintain a signal database
Missing metadata > Tests can’t be reproduced > Automated metadata capture
Corrupt files > Lost data > Validate checksums and create backups
At VTS, we embed these standards into every test programme to ensure data remains usable long after collection.
Step 3: Choose Tools That Match Your Data
Different tools suit different stages of analysis. Engineers at VTS use a combination of the following:
Tool > Best For
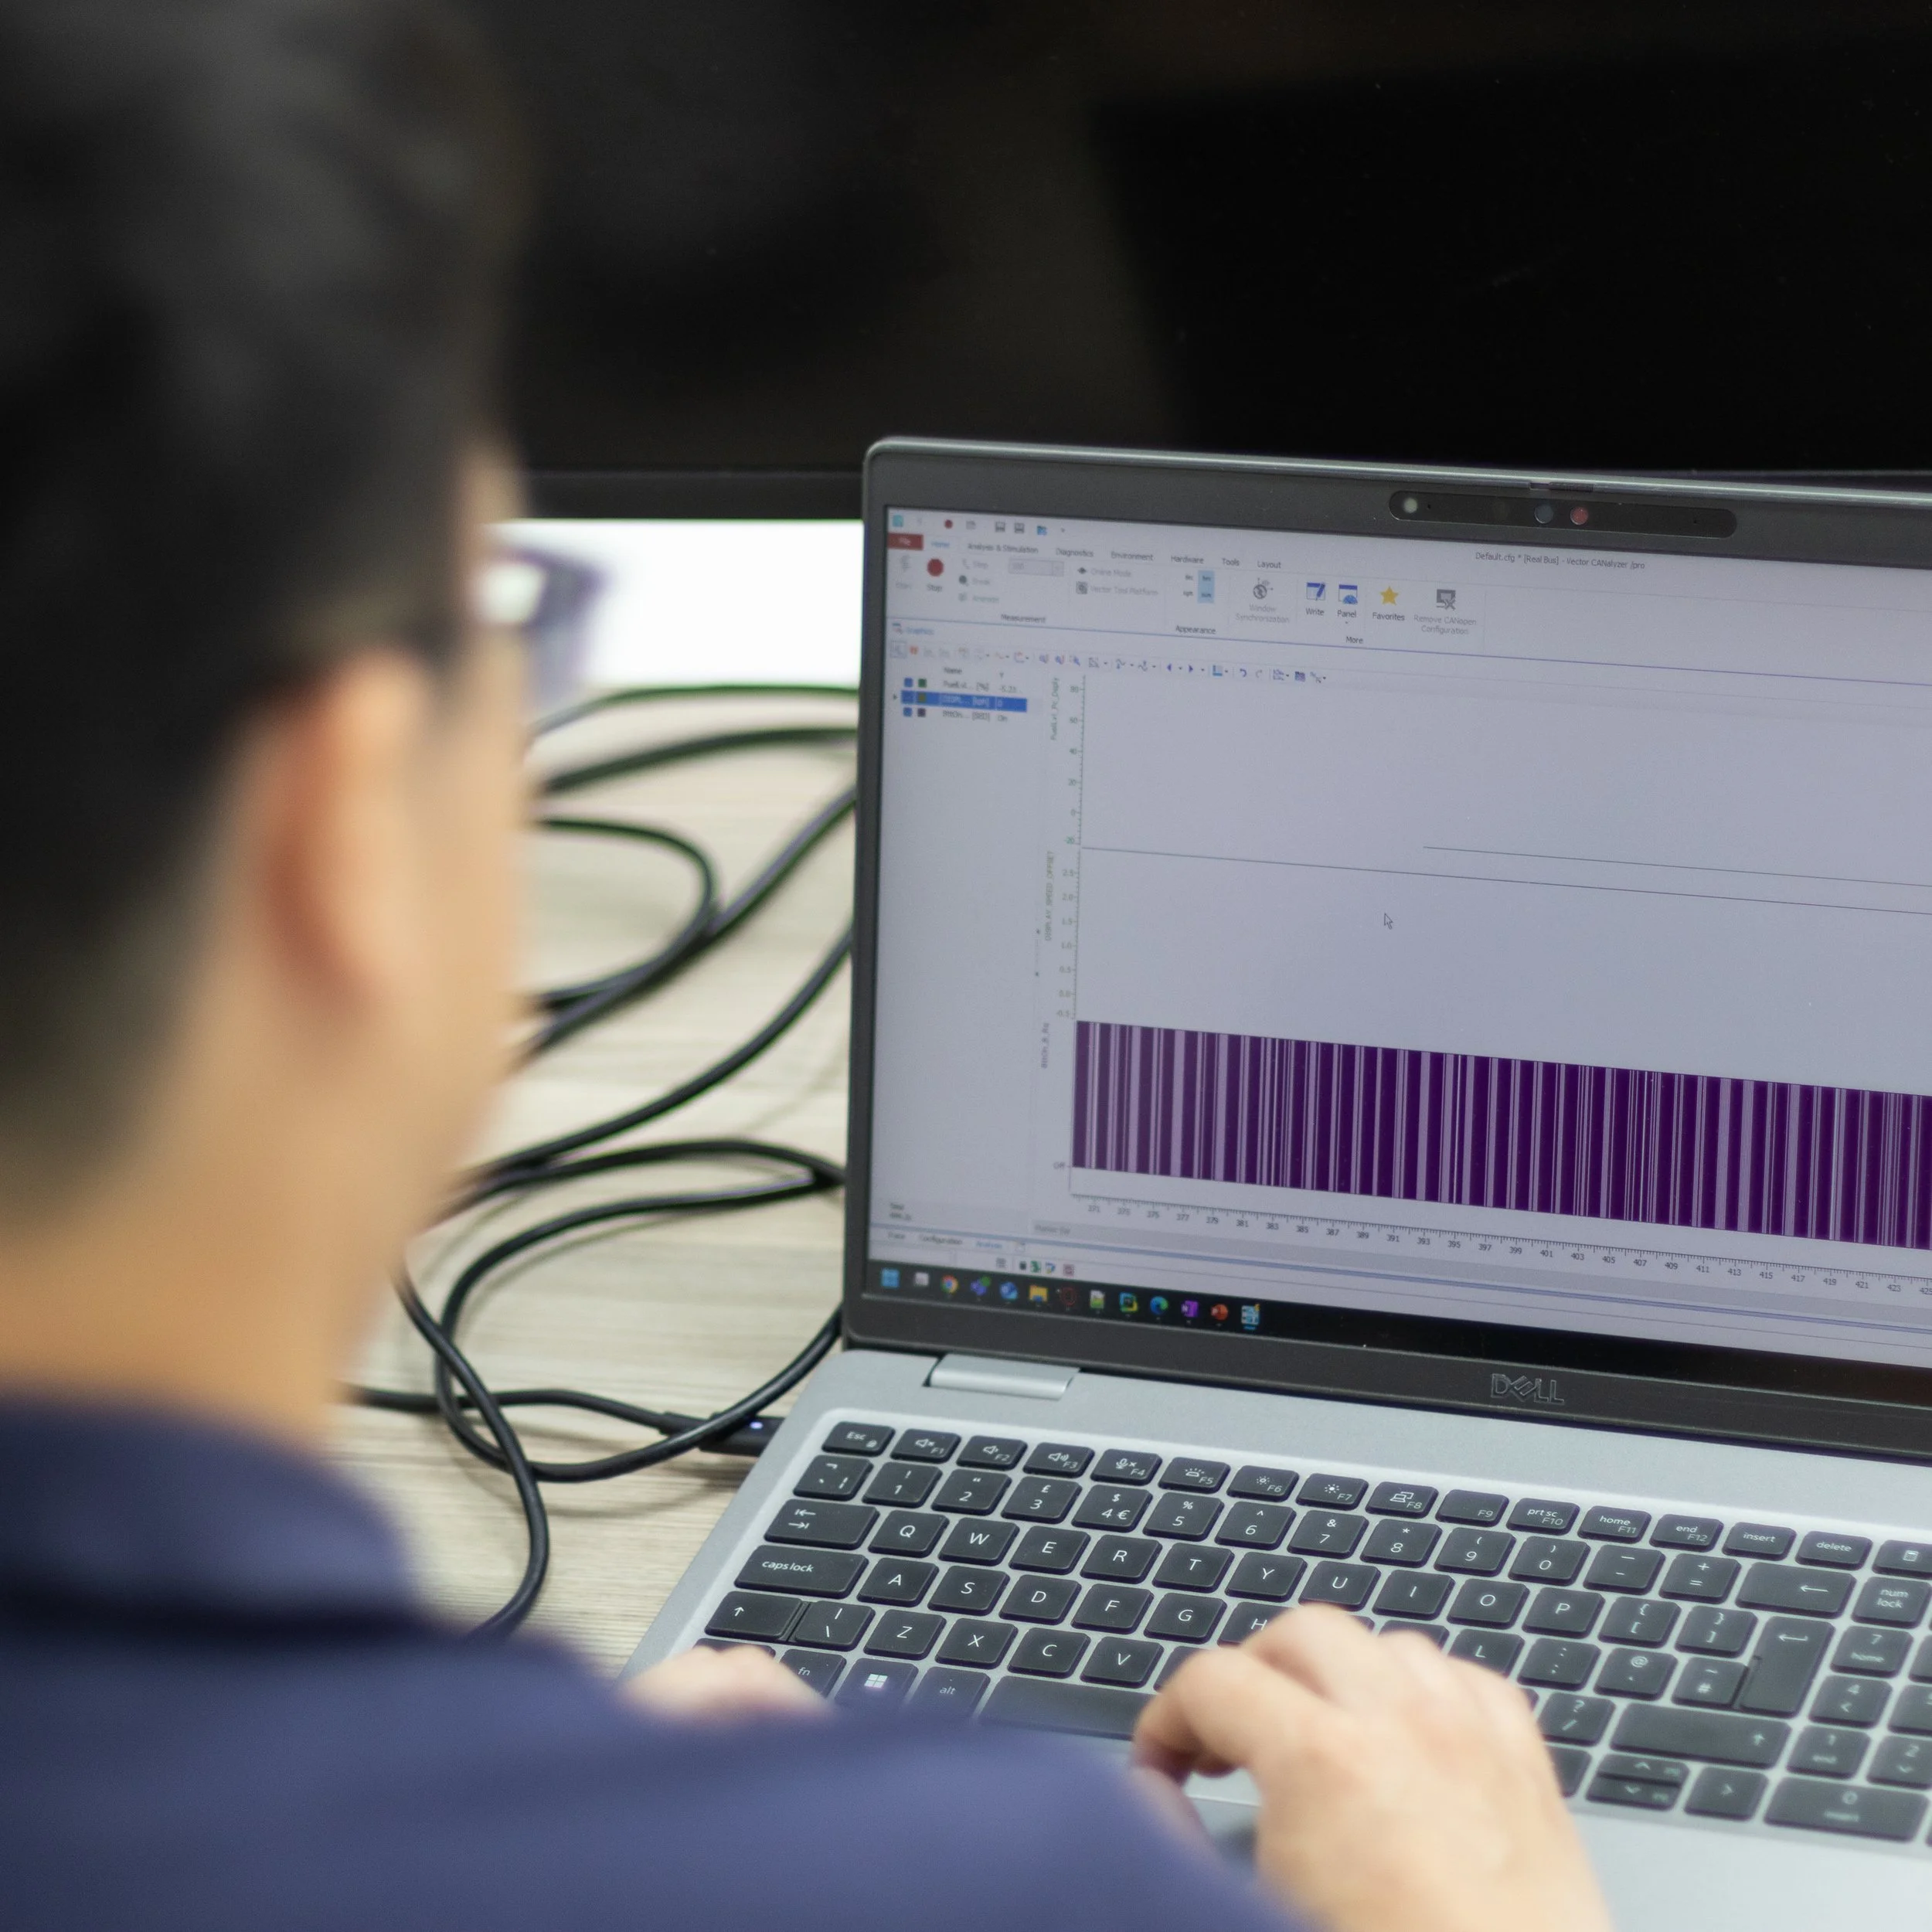
Vector CANalyser / Canoe > Network diagnostics, message decoding, and system timing correlation
MATLAB / Simulink > Complex signal processing, modelling, and validation scripting
Python > Automated data pipelines and test sequence processing
ETAS INCA > ECU calibration and live variable measurement
NI DIAdem > Multi-channel data management and automated reporting
For functional and end-to-end testing, consider tools that enable synchronisation and reproducibility:
• CANoe + Scope View for timing and correlation.
• XCP/CCP measurement for internal ECU variables.
• GPS-linked data loggers (RULA RL-R17, X2E XORAYA N4000) for aligning vehicle and network data.
• Automation layers (Python + DIAdem or CAPL) to replicate full functional sequences.
Step 4: Diagnose Issues Using Structured Analysis
Once your data is clean, the next step is to diagnose what’s really happening. Think like a systems engineer — every ECU, sensor, and node interacts within a wider environment. The goal isn’t only to see what failed, but why it failed within that system.
Visualise the data – Plot key signals over time (voltage, current, CAN traffic, temperatures) to identify anomalies.
Identify when and where the issue occurs – Correlate environmental, electrical, and software timing data.
Check dependencies and upstream influence – Determine if the ECU or component under test is being influenced by another module or gateway.
Consider system-level interactions – Evaluate behaviour across subsystems (timing, message sequencing, power modes).
Recreate and control the test environment – Adjust one factor at a time to isolate causes (temperature, voltage, load).
Cross-verify against reference data – Compare across vehicles, rigs, or software versions to find systemic differences.
Validate the cause and confirm the fix – Reproduce conditions, apply corrective action, and retest for stability.
Additional diagnostic considerations include:
Power supply stability – Voltage dips or shared grounds may distort readings.
Network load – Excessive CAN or Ethernet traffic can drop or delay messages.
Software configuration drift – Mixed software baselines cause inconsistent behaviour.
Temperature and vibration – Physical conditions influence sensor accuracy and hardware timing.
Logging setup – Breakout leads or measurement equipment can affect signal integrity.
Human/tester input – Manual sequencing or late actions can introduce data noise.
True functional validation connects electrical data, software logic, and physical behaviour, diagnosing across domains, not just within one log file.
In Summary
• Define objectives with clear system boundaries.
• Capture full system and configuration data for every test.
• Select tools that enable synchronised, system-level analysis.
• Diagnose issues methodically across electrical, software, and environmental domains.
• Interpret findings with functional and architectural context.
• Communicate clearly with system impact and next steps.
• Encourage curiosity and continuous learning in every analysis.
At VTS, we combine these principles with the right tools, expertise, and engineering mindset to help clients move faster, validate smarter, and deliver vehicles that perform reliably across every system interaction.


